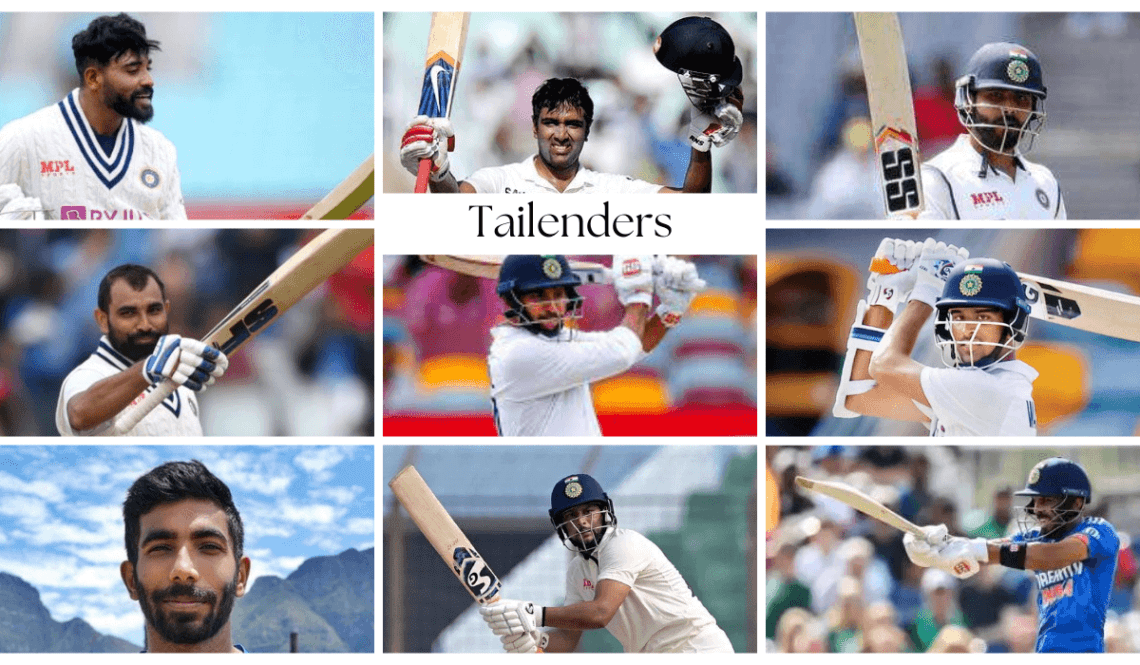
Tailenders – The tale of wagging tails, Whose do the best?
Tailenders are peculiar breed in cricket. In no other sport, including cricket, are you expected to do anything which is not your core skill. But in cricket, no matter how many great batsmen one has in their team, come the need, the bowlers have to go out and face the music. Even more so, even expected to contribute as much as possible.
More than any other format, it is the Tests where this expectation is more telling. Tailenders have to face the bouncers, tackle spinning ball and attempt to either save a match or add just the few more that might prove to be vital advantage. Hell, sometimes even ‘”protect” (as a night watchman) batsmen, who by the way, has trained and practiced to stay on the wicket and score runs.
That brings us to have a look into the contributions of tailenders (no. 8,9,10 and 11) in Test cricket when it comes to SENA countries and the subcontinent as time and again, batting contribution from these lower order batsmen changes the course of the match.
We have considered the time frame from last 4 years starting from Jan 2020. This can easily be extended to a much bigger period but it is always more relevant to look at the recent ones.
Tailenders Contribution in Subcontinent
| Team | Mts | Inn | Runs | HS | Avg | SR | 100 | 50 | 0 |
| India | 14 | 74 | 1255 | 106 | 23.24 | 50.28 | 1 | 7 | 14 |
| New Zealand | 6 | 37 | 469 | 68* | 18.03 | 39.24 | 0 | 2 | 7 |
| Pakistan | 17 | 98 | 997 | 64 | 14.66 | 44.80 | 0 | 3 | 13 |
| West Indies | 4 | 30 | 338 | 82 | 14.08 | 44.41 | 0 | 2 | 4 |
| Sri Lanka | 18 | 102 | 1113 | 104* | 13.91 | 46.62 | 1 | 2 | 19 |
| Australia | 9 | 48 | 483 | 93 | 12.38 | 48.05 | 0 | 1 | 8 |
| England | 9 | 57 | 491 | 43 | 11.41 | 46.45 | 0 | 0 | 8 |
| Bangladesh | 16 | 101 | 851 | 103 | 11.19 | 38.96 | 1 | 1 | 23 |
| South Africa | 2 | 16 | 72 | 21* | 5.53 | 39.13 | 0 | 0 | 7 |
Tailenders Contribution in SENA Countries
| Team | Mts | Inn | Runs | HS | Avg | SR | 100 | 50 | 0 |
| New Zealand | 21 | 107 | 1357 | 73 | 16.75 | 67.74 | 0 | 5 | 18 |
| England | 35 | 200 | 2435 | 97 | 16.23 | 62.08 | 0 | 3 | 25 |
| Australia | 25 | 123 | 1458 | 49 | 16.02 | 54.42 | 0 | 0 | 10 |
| West Indies | 10 | 75 | 885 | 86 | 15.52 | 54.12 | 0 | 4 | 13 |
| South Africa | 22 | 143 | 1506 | 84 | 13.32 | 50.98 | 0 | 4 | 24 |
| Pakistan | 8 | 56 | 566 | 91 | 13.16 | 44.81 | 0 | 2 | 12 |
| India | 18 | 125 | 1022 | 67 | 10.87 | 58.33 | 0 | 5 | 28 |
| Sri Lanka | 4 | 31 | 233 | 29 | 9.32 | 35.79 | 0 | 0 | 10 |
Summary
- Overall across conditions, only New Zealand can rely on their tailenders a lot more than others. While Indian tail, expectedly has the best avg in the subcontinent, but they are only slightly better than Sri Lankans in SENA conditions.
- Except New Zealand none of the SENA countries have had any contribution from the tailenders in subcontinent conditions.
- While English and Australian tail does better in SENA conditions, South African tail has pitiable numbers in all conditions which is surprising given their history of having a longish tail since the 90s.
- Overall, across conditions, in the last 4 years, the best avg for no. 8,9,10 and 11 is 23.24 which in itself does not look enough as far as impact on match is concerned. Once in a while though there are some contributions which gives an advantage.
- Although averages are better in the subcontinent, but SRs are much better in SENA countries.
These data points beg the question, about the over focus on the batting capability of bowlers which more times than not, even influences selections. If these numbers are anything to go by, it does not amount to much maybe in some rare cases. It primarily puts the onus on the top 6 or 7 to score runs. As a Test purist, we would say that should how it should be. Let the bowlers concentrate on bowling more and be ruthless in reviewing their bowling performances. Same goes for the batsmen. If a genuinely good bowler does have any batting capability (likes of Starc and Cummins for example), that could be a bonus.


